The short answer: at the moment, not really good, but some models are doing better than others. In this article we will provide an overview about the performance of global hydrological models in the Arctic, and why it matters to have models in good shape and fit for purpose. This article is based on the peer review paper entitled “Performance evaluation of global hydrological models in six large Pan-Arctic watersheds” led by Anne Gädeke from Potsdam Institute for Climate Impact Research (PIK) and other peers.
What drove this study?
The Arctic region is strongly affected by climate change and already today the implications are felt on-site, for example, by damaged infrastructure due to increased instability of the ground as a result of thawing permafrost. At the same time, changes occurring in the Arctic also have the potential to alter the global climate system. In the course of the last two decades, a lot of research has been dedicated to refining our understanding of observed trends in climate change impacts on the physical environment in the Arctic, their drivers, and possible implications. Most prominently is the melting of the Greenland ice sheet due to its contribution to sea-level rise. Less prominently, but of similar importance, has been the detection of increasing discharge of the Arctic rivers to the Arctic Ocean. A study published in the journal Science led by Peterson et al. (2002) found a 7% increase in river discharge of the large Siberian rivers (Yenisei, Ob, Lena, Kolyma) to the Arctic Ocean. Together with the melting of the Greenland ice sheet, the additional freshwater input to the Arctic Ocean has the potential to significantly alter Ocean currents that influence also the climate in lower latitudes. Despite the potential global effects, the underlying mechanisms causing increasing river discharge remain of scientific debate. Possible causes can include thawing of permafrost, increasing precipitation over the Arctic region, and melting of glaciers — but so far, not one of these processes could explain the documented increase in discharge by itself. Having lived in this part of the world and witnessed the rapid changes occurring, I became increasingly interested in investigating these knowledge gaps, and felt I could use my expertise as a water modeler to shade some light on these crucial questions.
Hydrological models present ideal tools to explore these processes and their interlinkages, and thus help to adress relevant societal questions such as “What are the drivers of hydrological change occurring in the Arctic?” and “What other impacts can we expect from climate change in the coming decades?”. However, to answer such questions, hydrological models must, at the very first step, be able to accurately reproduce the relevant hydrological processes. The way modelers are able to test the model’s accuracy is by comparing how the simulation results match observed records. For instance, by comparing the real measurements of the amount and timing of streamflow at a given streamflow measuring station with the values simulated by the model. A model is regarded to perform well if deviations between observed and simulated values are small (quantitatively) and the overall temporal dynamics between simulations and measurements match. A good-performing model is believed to be suitable for investigating process linkages and future climate change impacts.
Given the importance of having models fit-for-purpose, in the last few years, several efforts went into defining how to measure hydrological modeling performance, that is, what dimensions/metrics need to be considered in a performance assessment, and how to summarize the different metrics. One of such studies is Krysanova et al. (2018) who provided a thorough model performance evaluation guideline to increase the credibility of projections under climate change. Building on this effort, we have adapted the proposed performance methodology to evaluate how well commonly used global hydrology models represent Arctic hydrological processes - as the very first step to see if the models are “ready/useful” to tackle the more complex research questions. This exercise came with some additional challenges as observational data is scarce in the Arctic due to the remoteness of the region and the harsh environmental conditions. The lack of available data, both in terms of their spatial distribution over vast remote areas and time series length, affects the set-up, parameterization, and ultimately the performance of the different global hydrological models.
How did we evaluate the performance of global hydrological models?
We evaluated nine state-of-the-art global hydrological models (also including land surface models and dynamic global vegetation models) that are widely used by the global scientific community and participated in the ISIMIP2a simulation round. These refer to: WaterGAP2, DBH, H08, MPI-HM, PCR-GLOBWB, LPJmL, MATSIRO, ORCHIDEE, and JULES-W1. The two key differences of these models are the number of processes that are included (e.g. some models consider permafrost, while others don’t) and the level of detail in which certain processes are represented (e.g. some models have a much more detailed representation of snow accumulation and melt as oppose to others). The majority are classical water models (WaterGAP2, DBH, H08, PCR-GLOBWB) while other models (MATSIRO, ORCHIDEE, JULES-W1, LPJmL) were developed to explain the changes in vegetation dynamics and associated impacts on and linkages to the hydrological and carbon cycles.
We focus our investigation on the six largest Pan-Arctic watersheds, namely: Ob (Russia, Kazakhstan, China, Mongolia), Yenisei (Russia, Mongolia), Lena (Russia), Kolyma (Russia), Mackenzie (Canada), and Yukon (Canada, USA). The combined discharge from these six watersheds is the single largest freshwater source to the Arctic Ocean.
The performance of each model was evaluated by comparing simulated versus observed records for six different discharge indicators. To this end, we collected data from 18 different streamflow monitoring stations located across the 6 Arctic watersheds. On average, we managed to collect discharge measurements from up to 4 stations per watershed. The location of the stations is displayed in Figure 2. For the outlet stations, we had 30-year records of measured discharge with a daily resolution available and for the time period comprised between January 1971 and December 2000. For those other stations located upstream of the outlet, measured discharge was only available on a monthly scale and in some cases the time series length was shorter than 30 years. This means that some indicators have been estimated and compared using shorter series but always ranging between 20 to 30 years from between 1971 and the year 2000. The five hydrological indicators measured include:
- Mean monthly river discharge: average volume of water that flows through a river-cross section during a given month of the year. This indicator was calculated for each month over the available time period of the measurements.
- Long-term mean monthly discharge: average volume of water that flows through a river-cross section during a given month and averaged along a given time series. For example, the long-term seasonal discharge for January is based on the mean monthly river discharges for all Januarys within the considered time period and available records.
- Daily extreme high flows: daily flows that exceeded 10%, 5%, 1%, 0.1%, and 0.01% of recorded flows over the entire time period.
- Daily extreme low flows: daily flows that are exceeded in 90%, 95%, 99%, 99.9% of recorded flows over the entire time period.
- Snow water equivalent (SWE): monthly volume of water contained within the snowpack that will eventually be released when it melts.
Data used to populate the model
We retrieved the monthly observed discharge measurements from “The Global Streamflow Indices and Metadata Archive”. This is a freely available global collection of metadata on daily streamflow and hydrological indices from 12 different databases from across the world, which integrates the data from over 35000 flow measuring stations. To investigate extreme flows, we used the data from the “The Global Runoff Data Centre”. This database is also open source and collates daily and monthly river discharge data of more than 9,900 stations from 159 countries. Lastly, monthly measurements of snow water equivalent were obtained from the GlobSnow-2 product, which is derived from the European Spatial Agency (ESA).
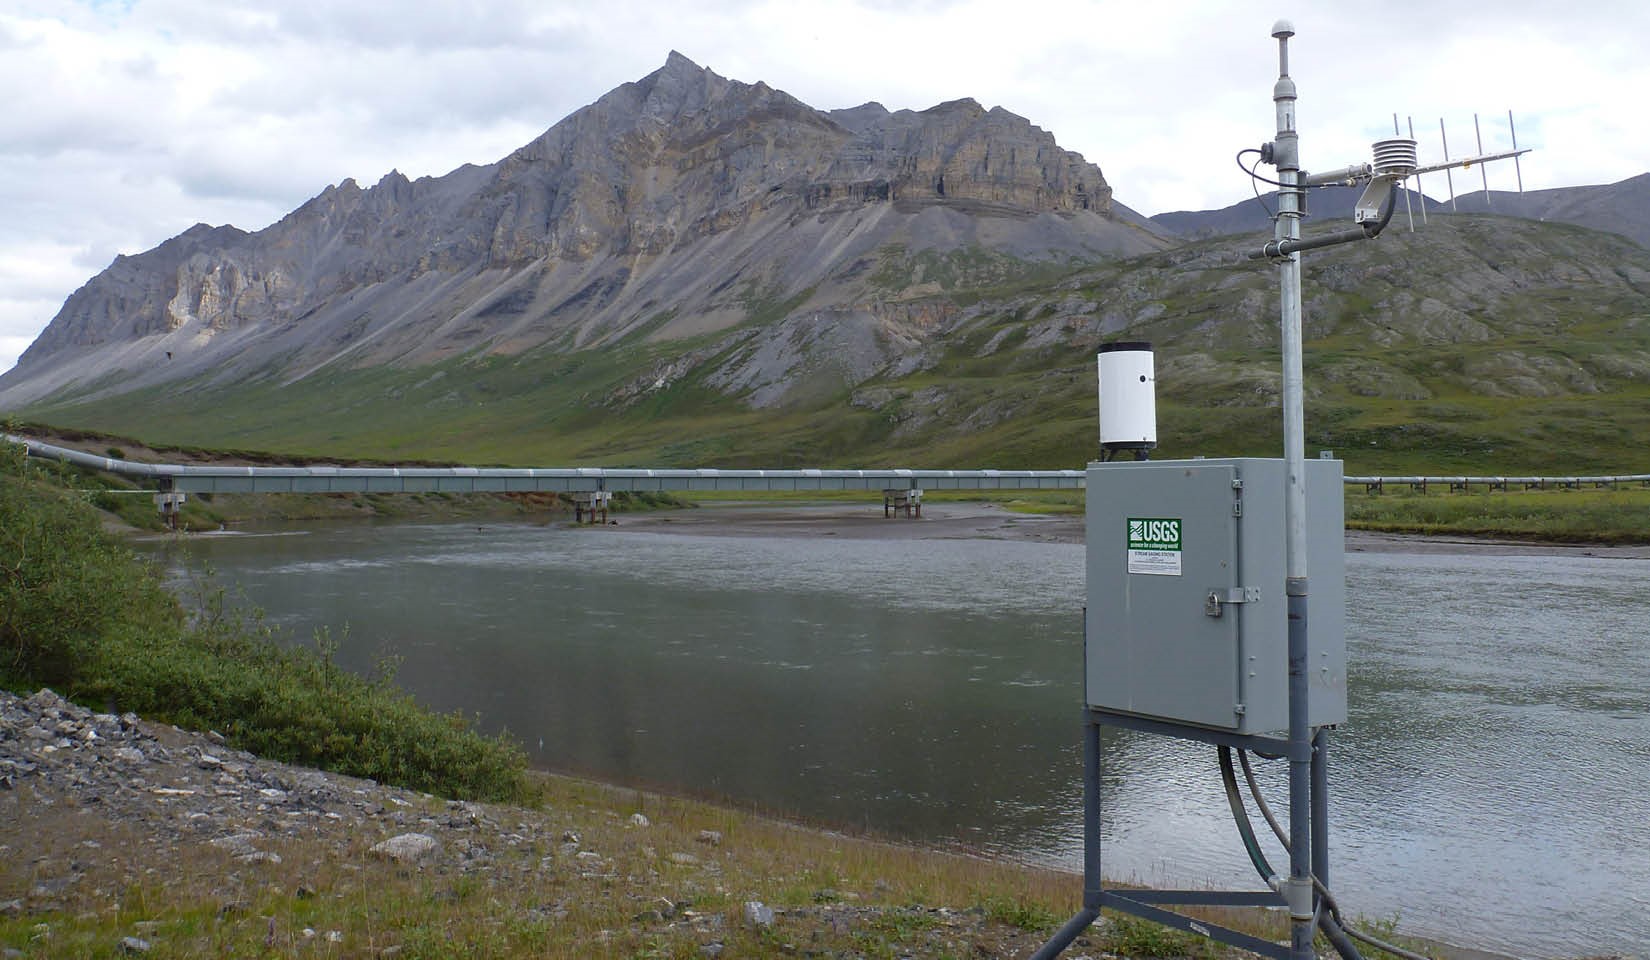
Streamgage station monitoring streamflow at the Atigun River in Alaska.
FIG 1 / Image source: Jeff Conaway for USGS, Alaska Science Center
The climate data used as meteorological input for each global hydrological model was obtained from ISIMIP (Phase 2a). These include four different climate datasets: Global Soil Wetness Project Phase 3 (GSWP3), Princeton, WATCH, and WFDEI.
The deviations between measured and simulated discharge can quantitatively be described by statistical indicators. These indicators were combined into the so-called Aggregated Performance Index (API). We developed four different APIs as a means to quantify the performance of the models to simulate different types of discharge and snow conditions:
- APIdischarge measures the performance of the models to represent mean monthly discharge and long term mean monthly discharge.
- APIlow measures the capacity of models to simulate extreme low flows.
- APIhigh measures the capacity of models to simulate extreme high flows.
- APISWE is intended to measure the model performance to simulate snow dynamics (snow accumulation and melting).
APIs values can range between 0% (poorest performance) and 100% (best performance). An API performance of 100% does not mean that simulations and observations match 100%, but rather that the statistical evaluation criteria are within the rather loose bounds of good performance that we have defined. Further technical details on the development and calculation of API can be found in the original published paper Gädeke et al. (2020).
How good are global hydrological models performing?
The majority of the global hydrological models exhibit difficulties in reproducing discharge and snow water equivalent in the Arctic watersheds. Models particularly struggle to simulate the snowmelt peak, the most important hydrological event in (sub)Arctic rivers, both in terms of absolute discharge amount and timing.
Figure 2 displays the boundaries of the six Arctic watersheds and the location of the different flow measuring stations. From the drop-down menu you can choose a hydrological model and a climate dataset. Also, you choose one of the hydrological performance indicators (APIs). Once selected, click on any station and a graph will be displayed and allow you to compare the observed records versus the modeled simulations. The API value is displayed next to the name of the station and refers to the average for the entire basin.
Looking at the different global hydrological models no model performs well for all indicators. One model might be good for one performance indicator, e.g. APIdischarge, whereas others are better for others. For example, WaterGAP2 is the model that performs, on average, the best when evaluating mean flow conditions. WaterGAP2 has a higher APIdischarge score in all watersheds except in Ob and Mackenzie (see Figure 2). The overall good model performance of WaterGAP2 for mean discharge conditions is also related to the fact that this model is calibrated i.e. some targeted model parameters are adjusted to obtain a better fit between the model results and the observations. Other models like MATSIRO perform, on average, best to simulate extreme low flows (APIlow), but scores differ substantially across the watersheds. The highest API scores are obtained in the Ob watersheds for the extremes.
Aggregated Performance Index and river discharge in the six largest Arctic watersheds
Select an aggregated performance index (API):
Simulated by the hydrological model, driven by the climate dataset.
Watersheds on the map are colored according to how models perform in the face of measurements, as assessed by the various APIs (

FIG 2 / Adapted from Gädeke et al. (2020).
The results of this research reveal that, despite the differences found across single models and watersheds, models are at this stage best at simulating monthly and seasonal discharge (APIdischarge), although averaged performance score is 43%. Likewise, models are performing relatively well to simulate snow water equivalent, with an average score across models and watersheds for APISWE equivalent to 57%. The capacity to simulate extreme flows is however still very poor for most models, especially for low flows (APIlow), where the average of all models does not surpass the 26%. Similarly, the model average performance for high daily flows (APIhigh), is 35%. The yet limited performance of these models is due to a combination of factors, including: 1) the absence or simplified representation of key hydrological processes in the current version of the models; 2) the inherent difficulties in obtaining reliable measurements in this part of the world, and 3) the lack of observational data and meteorological stations due to the harsh environmental conditions. We will discuss next some of these barriers more in detail.
What explains the current performance and how to overcome existing barriers?
Limited representation of cold region hydrological processes in models
Snow hydrological processes are represented in a very simplistic manner in the global hydrological models. This includes, among others, the simulation of the start of snowmelt, the path snowmelt takes on the landscape (entering the (still frozen) soil, refreezing, overland flow), snow compaction and the distribution of snow on the landscape (deeper snow accumulation on depressions compared to thin snow cover on slopes which is very difficult to represent at the relatively coarse resolution of the global hydrological models).
The limited representation of snow dynamics also has a great influence on the ground temperature i.e. permafrost due to its insulating properties, e.g. a thick snow cover during winter will serve as a “blanket” shielding the ground from extreme cold air temperatures. Therefore, in regions with high snowfall during winter, warmer ground temperature (and potentially less permafrost) can be found compared to Arctic regions with only low snowfall. These feedback mechanisms are of great importance to represent in the models when it comes to assessing and evaluating climate change impacts. Permafrost and its effect on hydrological processes such as infiltration and water flow through the frozen soil is only considered by MATSIRO, JULES-W1 and LPJmL. Other models, such as WaterGAP2, PCR-GLOBWB and MPI-HM, present permafrost coverage statically and without making an explicit linkage to hydrology. Improving the representation of permafrost and its dynamics in the models is crucial to get a more realistic representation of cold-region hydrological processes and evaluate the impacts of climate change.
Observations are scarce in the Arctic
As mentioned earlier an important challenge of working in this part of the world is the lack of observational data in terms. For this research, we relied on daily discharge records available at the watershed outlets. These watersheds often cover very large territories of up to 3 mill km² in some cases like the Ob watershed and thus present very diverse climate and geographic characteristics. Evaluating model performance at the outlet is a way to measure how the model performs “on average”, but it does not tell us if the model is properly simulating the hydrological dynamics within the watershed. Although we also had monthly discharge records from 1-3 additional stations within each watershed, models will benefit from having more long-term records of daily discharge in different points of the watersheds to improve the process understanding, and ultimately their performance.
Another aspect influencing model performance evaluation is the difficulty of measuring discharge (and water level) in Arctic rivers due to the harsh environmental conditions and the remoteness of the area. Rivers are ice-covered for the majority of the winter season. Under-ice discharge measurements are challenging and have a high uncertainty. Therefore not only simulated discharges during the winter season must be evaluated with care but the measurements can also only be regarded as estimates.
The limited ability of the model to simulate snow accumulation and melt processes is also limited due to a lack of continuous observations covering larger areas. Often only individual measurements are taken, for instance at weather stations. Those point measurements are insufficient to accurately describe the spatial variability of snow accumulation. We used satellite data to overcome existing spatial inaccuracy derived from weather stations, but, resulting estimates are, however, known to contain also considerable uncertainties. While satellite data and remote sensing techniques are very advanced for detecting snow cover, other relevant aspects such as depth (and water equivalent contained within the snowpack) are not so easy to measure.
Modeling at the global scale
Last but not least, the spatial scale at which the simulations are carried out is coarse and therefore accurate estimates are difficult. The simulation units are grid cells of about∼50 km × 50 km at the equator, which means all processes occurring below this scale are not represented or simply averaged out.
What are our recommendations based on this model evaluation concerning climate change impact assessments?
Our study has shown that models in this part of the world are still struggling to represent key hydrological processes, and that such gaps need to be understood and addressed before conducting a climate change impact assessment. This lesson is of importance to the Arctic but also valid for any study elsewhere. As for the Arctic, it is necessary to refine our understanding of the hydrological changes occurring based on field observations. Only those models that show good or satisfactory evaluation results and that represent cold-region hydrological processes effectively should be applied in climate change impact assessments. In this study, we concluded that models meeting these criteria include WaterGAP2, MATSIRO, MPI-HM for monthly/seasonal streamflow, MATSIRO and LPJmL for high flows and MATSIRO for low flows. All other models require performance improvements and all except JULES-W1 lack the incorporation of a dynamic permafrost module (=simulation of soil freeze/thaw processes).
Acknowledgements
This summary article was written in collaboration with the ISIpedia Editorial Team.
Contact
Please contact the ISIpedia Editorial Team (isipedia.editorial.team@pik-potsdam.de) for more information or questions about this report.
References
Cover image: Cape Bounty Arctic Watershed Observatory
Affiliations
1 Climate Resilience Department of Potsdam Institute for Climate Impact Research (PIK), Germany